Highlights of
Eastern Visayasí export and import statistics: March 2018
By
PSA-8
June 19, 2018
TACLOBAN CITY Ė The
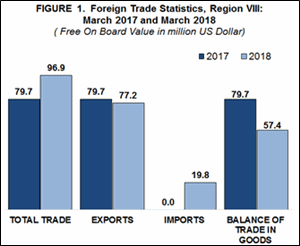
regionís total trade in goods in March 2018 amounted to $96.9
million, an increase of 21.6% over the value of $79.7 million
registered in the same month last year. Total exports amounted to
$77.2 million, which was 3.2% lower compared with the $79.7 million
in March 2017. Total value of imports, meanwhile, was recorded at
$19.8 million from zero imports posted in the same period last year.
 The
region reflected a surplus in the total balance of trade in goods (BoT-G)
amounting to $57.4 million in March 2018. This is 28.0% lower
compared with the $79.7 million surplus recorded in the same period
a year ago.
Exports
The regionís total volume
of exports in March 2018 was at 73.8 million kilograms.
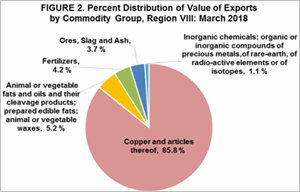
Copper and Articles
thereof was the major commodity group exported during the month with
total revenue of $66.2 million, accounting for more than four-fifths
or 85.8% of the regionís total exports revenue in March 2018.
Animal or Vegetable Fats
and Oils and their Cleavage Products; Prepared Edible Fats; Animal
or Vegetable Waxes recorded $4.0 million export revenue, which
accounted for 5.2% of the total export revenue. Fertilizers earned
an export revenue of $3.3 million or 4.2% share of the total exports
revenue. Ores, Slag and Ash exports amounted to $2.9 million, which
shared 3.7% of the total exports. Inorganic Chemicals; Organic or
Inorganic Compounds of Precious Metals, of Rare-Earth, of
Radio-Active Elements or of Isotopes, meanwhile, recorded less than
a million exports revenue ($0.8) or 1.1% of the total export
revenue.
 Peopleís
Republic of China was the top export market destination with
recorded total exports revenue of $69.4 million or 89.9% of the
regionís total exports. United States of America ranked second with
$4.0 million export revenue or 5.2% of the total exports in March
2018, followed by Vietnam with $3.3 million export receipts,
accounting for 4.2% of the regionís total exports. India recorded
the least exports valued at $0.5millionor 0.7% of the total exports
of the region.
Imports
The regionís total imports
amounted to $19.8 million in March 2018 with total gross weight of
136.4 million kilograms.
 Inorganic
Chemicals; Organic or Inorganic Compounds of Precious Metals, of
Rare-Earth, of Radio-Active Elements or of Isotopes commodity group
and Mineral Fuels, Mineral Oils and Products of their Distillation;
Bituminous Substances; Mineral Waxes commodity group were the major
imports during the month, both with total revenue of $5.7 million,
each accounting for 28.7% of the regionís total imports in March
2018.
The next largest imported
commodity group was Salt, Sulphur, Earths and Stone; Plastering
Materials, Lime and Cement, with imports value at $4.3 million,
comprising 21.8% of the total imports in March 2018. It was followed
by Miscellaneous Chemical Products with imports value of $2.6
million, 13.2% share to the total imports of the region.
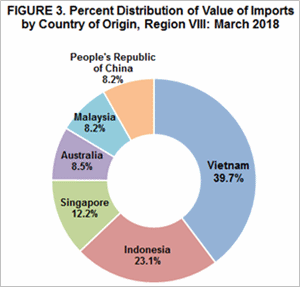
The top import supplier of
the region was Vietnam, which recorded a total imports bill of $7.8
million or almost two-fifths (39.7%) of the regionís total imports.
Indonesia ranked second with $4.6 million import bill or 23.1% of
the total imports for March. Singapore ranked third with total
imports valued at $2.4 million contributing 12.2% of the total
regional imports.